
- Bitcoin is not giving up and is aiming to reach the new heights to escape the downtrend. When to expect BTC overcoming the $9 target? Traders are sure we need to wait some time – this price is a mid-term target. Why so? Read BTC price predictions from tradingview users.
What is the critical point?
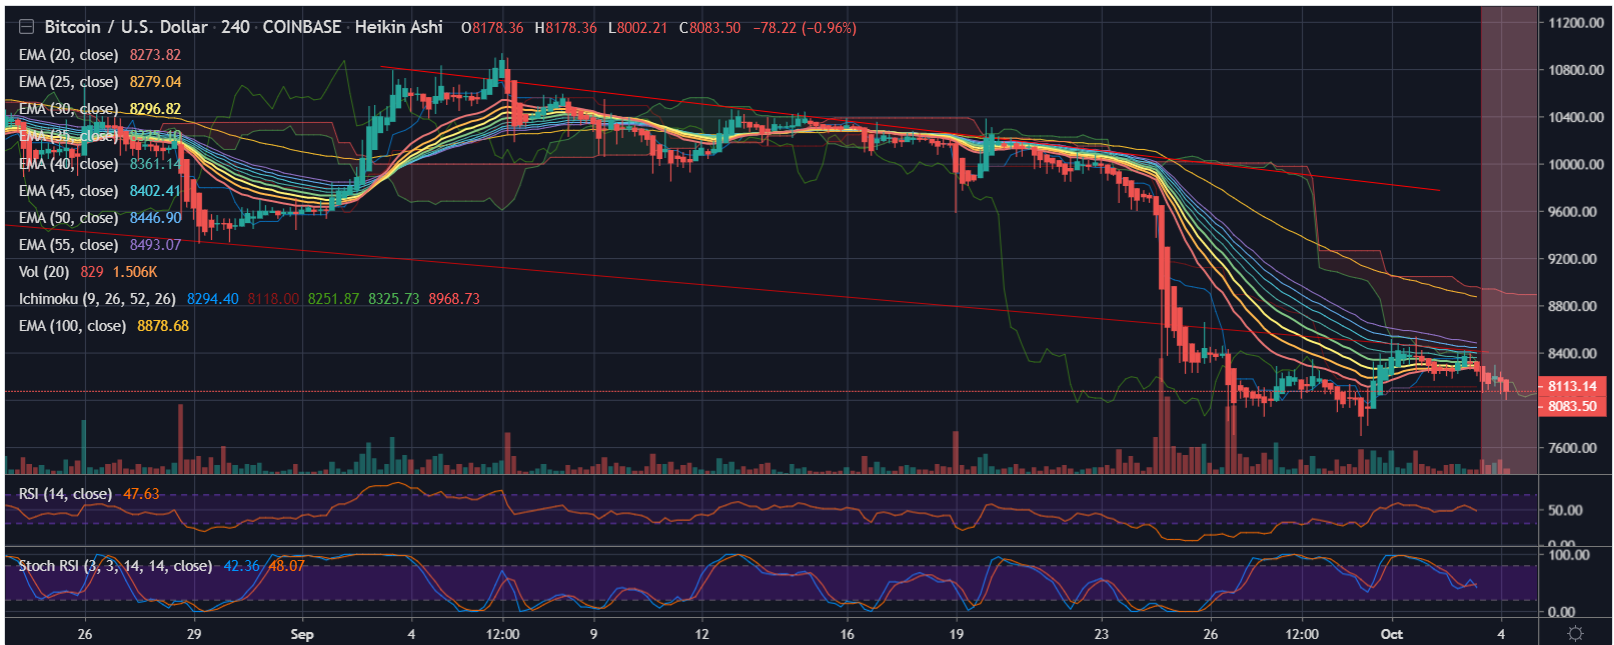
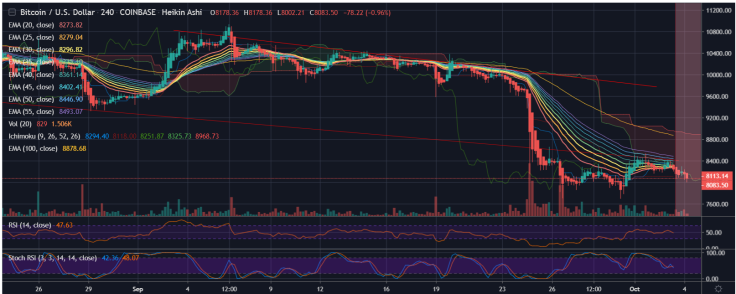 Bitcoin (BTC) price chart by TradingViewOver the past days, the first days of October, we saw Bitcoin price trying to recover in consolidation between the marked descending trend-line on the 4-hour chart and $8,200 from below. This seems like another mini bearish triangle. Another thing to note is that if there won’t be any momentum shift, the possibility for a Death Cross becomes real.Not long afterward, Bitcoin started its massive 3-month move towards the 2019 high at $13,880.What to watch for to track Bitcoin’s moves?
- Support/Resistance. Further above is $8,750 – $8,800 resistance area , which contains the 38.2% Fibonacci retracement level. The next resistance lies at $9,000, whereas the real test for Bitcoin bulls is located at $9,400 – $9,500 which contains the ascending trend-line (of the famous 2019 bearish triangle which got broken recently, shown on the daily chart ) along with the 61.8% Fibonacci retracement level (the “Golden Fib”).
- The RSI Indicator (Daily): Nothing new is coming on behalf of the RSI. The Stochastic RSI oscillator had made a crossover and moving now in the neutral area, which might give some fuel to break above the critical resistance.
- The Trading Volume: Since the huge breakdown a week ago, the total volume is declining over time. As of writing this, yesterday seems like the dull days of the first two weeks during September. This setting probably indicates a short-term coming up move.
Upward correction is possible
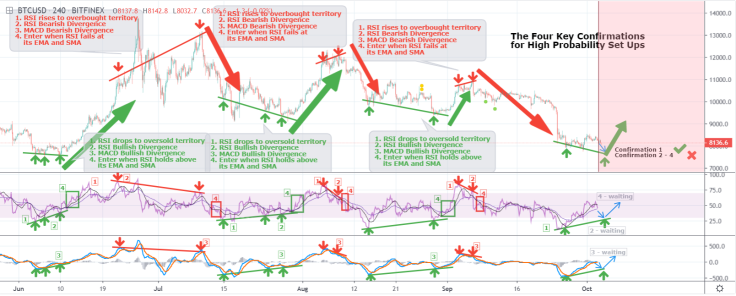 Bitcoin (BTC) price chart by TradingViewUser Phi-Deltalytics also claims there’s a potential BTC upward correction with a good risk-reward ratio. However, as we all know, the market could always surprise us. Here are the four common but key confirmations we love for entering major positions at the targeted zones.
- RSI goes to overbought/oversold territories
- RSI bullish divergence
- MACD bullish divergence
- RSI holds/fails its EMA and SMA
AB=CD pattern is possible
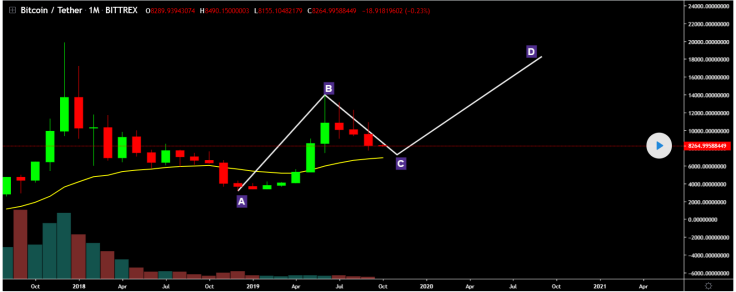 Bitcoin (BTC) price chart by TradingViewOn the chart from Make_Money_Guru_Bitcoin, we can see there is BTC/USDT POSSIBILITY OF AB=CD pattern, which means BTC might reach the final bottom $7.3 K in October and start raising only in November.
 - Via u.today.com


Bitcoin Is To Break Downtrend: BTC Price Aims $9K Target In the Mid Term
![Bitcoin Is To Break Downtrend: BTC Price Aims $9K Target In the Mid Term]() Reviewed by asus
on
October 06, 2019
Rating:
Reviewed by asus
on
October 06, 2019
Rating:

